Exploring Recipes dataset via Random Forest
Name(s): Xiangzhi Jiang (xzjiang@umich.edu)
Step 1: Introduction
Core Question: Can we predict how well a recipe will be rated — before any user has rated it — using only basic information like preparation time, complexity, and tags?
In this project, we focus on forecasting the average rating of each recipe on Food.com using only metadata available prior to any user interaction. This includes numeric features that reflect preparation effort, and categorical tags that capture recipe themes or constraints (e.g., “vegan”, “holiday”, “easy”).
Why this matters:
- Platforms can promote highly rated recipes even before enough user ratings accumulate.
- Recipe creators can receive feedback on structure and categorization, independent of taste or visuals.
Datasets
We use two datasets:
RAW_recipes.csv– 83,782 entries with recipe-level metadataRAW_interactions.csv– 731,927 user ratings and reviews
Task Setup
This is a regression task. The response variable is the average rating per recipe, calculated from the RAW_interactions.csv data.
We limit our model to four features:
| Feature | Type | Description |
|---|---|---|
minutes |
Quantitative | Total time (in minutes) to prepare the recipe |
n_steps |
Quantitative | Number of procedural steps — a proxy for recipe complexity |
n_ingredients |
Quantitative | Count of distinct ingredients used |
tags |
Categorical | List of user-assigned labels — dietary, cultural, seasonal, or topical |
These features were selected because they are:
- Available before users interact with the recipe
- Plausible proxies for user satisfaction
- Interpretable and useful for platform design or recipe refinement
Step 2: Data Cleaning and Exploratory Data Analysis
Cleaning Steps and Rationale
-
Merge Datasets
We join the recipe metadata with user interactions using the recipe ID. This allows us to associate each recipe with its user ratings. -
Replace Zero Ratings
Ratings of 0 are treated as invalid or missing, and are replaced withNaN. They may arise from submission errors or default placeholders. -
Compute Average Rating
We aggregate individual user ratings to create a per-recipe average — our target variable. This is the value we aim to predict. -
Quantile Trimming
We remove outliers in the quantitative features (minutes,n_ingredients,n_steps) by trimming to the 2.5–97.5 percentile range. This reduces skew and improves model stability.
Visual Explorations
⏱️ Average Rating vs. Cooking Time

We observe that recipes under 100 minutes tend to have a wider spread of ratings, but overall the average rating remains relatively stable. However, some long-duration recipes receive lower ratings, hinting that minutes may capture subtle user frustration or expectation mismatches.
🪜 Average Rating by Number of Steps
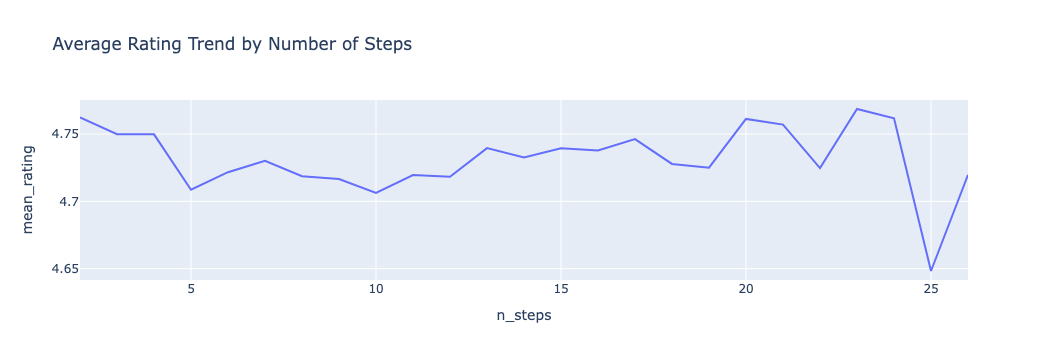
This plot reveals that highly complex recipes (with more than 20 steps) slightly trend toward higher ratings, suggesting that advanced users may appreciate detailed guidance. However, the overall variation is subtle and nonlinear — supporting later use of feature engineering like steps_per_ing.
⭐ Distribution of Average Ratings
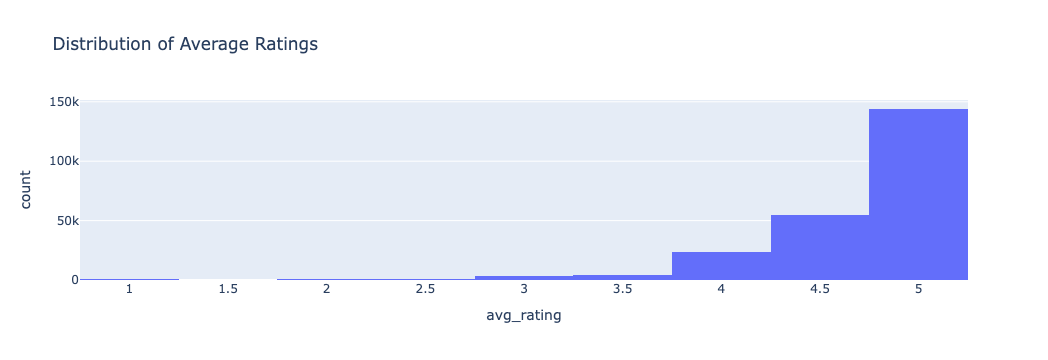
The average ratings are heavily right-skewed, with most clustered between 4.5 and 5. This distribution suggests user generosity or rating inflation — an important contextual factor when interpreting model performance.
merged = pd.merge(recipes, interactions, how="left", left_on="id", right_on="recipe_id")
merged["rating"] = merged["rating"].replace(0, np.nan)

avg_rating = merged.groupby("id")["rating"].mean()
merged["avg_rating"] = merged["id"].map(avg_rating)
merged["nutrition"] = merged["nutrition"].apply(eval)
nutrition_cols = ["calories", "total_fat", "sugar", "sodium", "protein", "saturated_fat", "carbohydrates"]
for i, col in enumerate(nutrition_cols):
    merged[col] = merged["nutrition"].apply(lambda x: x[i] if isinstance(x, list) and len(x) > i else np.nan)

merged["submitted"] = pd.to_datetime(merged["submitted"])
merged["date"] = pd.to_datetime(merged["date"], errors='coerce')

q_minutes = merged["minutes"].quantile([0.025, 0.975])
q_ingredients = merged["n_ingredients"].quantile([0.025, 0.975])
q_steps = merged["n_steps"].quantile([0.025, 0.975])
q_rating = merged["avg_rating"].quantile([0.025, 0.975])

filtered = merged[
    (merged["minutes"] >= q_minutes[0.025]) & (merged["minutes"] <= q_minutes[0.975]) &
    (merged["n_ingredients"] >= q_ingredients[0.025]) & (merged["n_ingredients"] <= q_ingredients[0.975]) &
    (merged["n_steps"] >= q_steps[0.025]) & (merged["n_steps"] <= q_steps[0.975]) &
    (merged["avg_rating"] >= q_rating[0.025]) & (merged["avg_rating"] <= q_rating[0.975])
].copy()


fig1 = px.histogram(merged, x="avg_rating", nbins=20, title="Distribution of Average Ratings")
fig1.show()

fig2 = px.scatter(filtered, x="minutes", y="avg_rating",
                  title="Average Rating vs. Cooking Time (Filtered)",
                  opacity=0.5, trendline="ols")
fig2.show()

bar_df = filtered.groupby("n_ingredients").agg(
    mean_rating=("avg_rating", "mean"),
    count=("avg_rating", "count")
).reset_index()


line_df = filtered.groupby("n_steps").agg(mean_rating=("avg_rating", "mean")).reset_index()

fig4 = px.line(line_df, x="n_steps", y="mean_rating",
               title="Average Rating Trend by Number of Steps")
fig4.show()

grouped = merged.groupby("n_ingredients")["avg_rating"].agg(["count", "mean"]).reset_index()
grouped.columns = ["n_ingredients", "num_recipes", "mean_avg_rating"]
grouped_sorted = grouped.sort_values(by="n_ingredients")

grouped_sorted.head(10)

merged["avg_rating_filled"] = merged["avg_rating"].fillna(merged["avg_rating"].mean())
Step 3: Defining the Prediction Task
🎯 Prediction Target: avg_rating
We compute the average rating for each recipe from all available user interactions. This rating is bounded between 1 and 5 and serves as the ground truth for our regression model.
✅ Justification for Feature Usage
All four input features were chosen because they are:
- Available at the time of recipe publication
- Likely to influence how users perceive and rate a recipe
| Feature | Reason for Inclusion |
|---|---|
minutes |
Longer or very short prep times may affect user satisfaction |
n_steps |
Captures procedural complexity — longer instructions might deter or attract users |
n_ingredients |
Reflects how resource-intensive a recipe is |
tags |
Encodes important categorical signals such as dietary restrictions or seasonal usage |
📏 Evaluation Metrics
To evaluate the quality of our model, we use:
- Mean Squared Error (MSE)
- R² Score (Coefficient of Determination)
Step 4: Baseline Model
To build a simple and interpretable reference model, we start with a linear regression using four original features:
Preprocessing
We applied the following preprocessing pipeline:
- Numerical features (
minutes,n_steps,n_ingredients): Scaled withStandardScaler - Categorical features (
tags): Simplified to a single tag and encoded usingOneHotEncoderThis ensures consistent scaling and categorical feature handling.
model_df = filtered[["minutes", "n_steps", "n_ingredients", "tags", "avg_rating"]].dropna()

X = model_df.drop(columns=["avg_rating"])
y = model_df["avg_rating"]

X_train, X_test, y_train, y_test = train_test_split(X, y, test_size=0.2, random_state=42)

def simplify_tags(tag_str):
    try:
        tags = eval(tag_str)
        return tags[0] if isinstance(tags, list) and tags else "unknown"
    except:
        return "unknown"

X_train["tags"] = X_train["tags"].apply(simplify_tags)
X_test["tags"] = X_test["tags"].apply(simplify_tags)

numeric_features = ["minutes", "n_steps", "n_ingredients"]
categorical_features = ["tags"]

preprocessor = ColumnTransformer(transformers=[
    ("num", StandardScaler(), numeric_features),
    ("cat", OneHotEncoder(handle_unknown="ignore"), categorical_features)
])

baseline_model = Pipeline(steps=[
    ("preprocessor", preprocessor),
    ("regressor", LinearRegression())
])

baseline_model.fit(X_train, y_train)
y_pred = baseline_model.predict(X_test)

mse = mean_squared_error(y_test, y_pred)
r2 = r2_score(y_test, y_pred)

print("Baseline Linear Regression Results (4 original features):")
print(f"  MSE: {mse:.4f}")
print(f"  R^2: {r2:.4f}")
Step 5: Final Model with Feature Engineering
To enhance the model’s expressiveness and capture more nuanced structure in the data, we engineer the following new features:
log_minutes: logarithmic transformation of preparation time to compress skewed distributionstep_density: number of steps per minute (complexity relative to time)ingredient_density: number of ingredients per minute (resource density)steps_per_ing: number of steps per ingredient (a proxy for granularity or precision)
These derived features aim to capture nonlinear interactions between effort, complexity, and recipe structure.
The categorical tags column is still simplified to its first tag and one-hot encoded.
We use a Random Forest Regressor with hyperparameter tuning via GridSearchCV to handle nonlinearity and categorical splits efficiently.
model_df = filtered[["minutes", "n_steps", "n_ingredients", "tags", "avg_rating"]].dropna()
model_df["log_minutes"] = np.log1p(model_df["minutes"])
model_df["step_density"] = model_df["n_steps"] / model_df["minutes"].replace(0, np.nan)
model_df["ingredient_density"] = model_df["n_ingredients"] / model_df["minutes"].replace(0, np.nan)
model_df["steps_per_ing"] = model_df["n_steps"] / model_df["n_ingredients"].replace(0, np.nan)

feature_cols = ["log_minutes", "step_density", "ingredient_density", "steps_per_ing", "tags"]
X = model_df[feature_cols]
y = model_df["avg_rating"]

X_train, X_test, y_train, y_test = train_test_split(X, y, test_size=0.2, random_state=42)

def simplify_tags(tag_str):
    try:
        tags = eval(tag_str)
        return tags[0] if isinstance(tags, list) and tags else "unknown"
    except:
        return "unknown"

X_train["tags"] = X_train["tags"].apply(simplify_tags)
X_test["tags"] = X_test["tags"].apply(simplify_tags)

numeric_features = ["log_minutes", "step_density", "ingredient_density", "steps_per_ing"]
categorical_features = ["tags"]

preprocessor = ColumnTransformer(transformers=[
    ("num", StandardScaler(), numeric_features),
    ("cat", OneHotEncoder(handle_unknown="ignore"), categorical_features)
])

final_pipeline = Pipeline(steps=[
    ("preprocessor", preprocessor),
    ("regressor", RandomForestRegressor(random_state=42))
])

param_grid = {
    "regressor__n_estimators": [100, 200],
    "regressor__max_depth": [5, 10, 15],
    "regressor__min_samples_split": [2, 5]
}

total_combinations = len(ParameterGrid(param_grid))
print(f"🔧 Total grid combinations: {total_combinations}")

start_time = time.time()

grid_search = GridSearchCV(
    final_pipeline,
    param_grid,
    cv=3,
    scoring="neg_mean_squared_error",
    n_jobs=-1,
    verbose=2
)
grid_search.fit(X_train, y_train)

end_time = time.time()
duration = end_time - start_time
print(f"\n⏱️ Total training time: {duration:.2f} seconds")

y_pred = grid_search.best_estimator_.predict(X_test)
mse = mean_squared_error(y_test, y_pred)
r2 = r2_score(y_test, y_pred)

print("\n Final Model: Random Forest with 4 Engineered Features")
print(f"Best Params: {grid_search.best_params_}")
print(f"MSE: {mse:.4f}")
print(f"R²: {r2:.4f}")
Conclusion
This project explored how simple metadata from Food.com recipes — including time, ingredients, and tags — can be used to predict average user ratings before any reviews are submitted.
We began with a baseline linear regression using raw features. While interpretable and efficient, its performance was limited:
- Baseline RMSE: 0.1269
- Baseline R²: 0.0061
The low R² value suggests that the linear model explained very little variance in the target, likely due to:
- nonlinear relationships between preparation time and satisfaction
- interaction effects between complexity and ingredients
- underutilization of latent structure in categorical tags
To address these limitations, we engineered four domain-informed features: We then used a Random Forest Regressor, which yielded notable gains:
- Final RMSE: 0.1128
- Final R²: 0.1162
- Best Parameters:
max_depth=15,min_samples_split=2,n_estimators=200
Why Random Forest?
Random Forests are well-suited for this task because:
- They naturally model nonlinear relationships without requiring explicit transformations
- They handle categorical encodings (like one-hot tags) robustly
- They are less sensitive to feature scale and outliers
- They can capture interactions between features such as time-effort tradeoffs
Despite the modest R², the observed improvement over the linear baseline confirms that more expressive models and thoughtfully engineered features can extract additional structure from even simple recipe metadata. Future work could incorporate textual reviews or image embeddings to further boost performance.